Office Work and Data Visualization
Free Office Work and Data Visualization illustrations in SVG, PowerPoint, Google Slides, and Canva
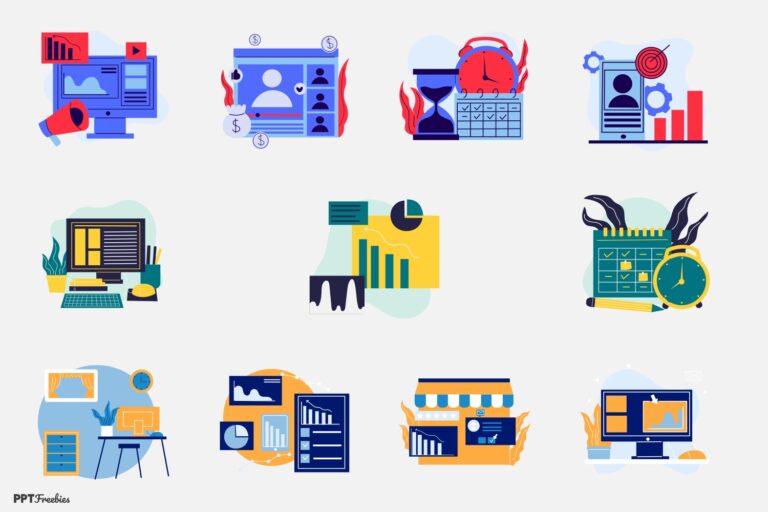
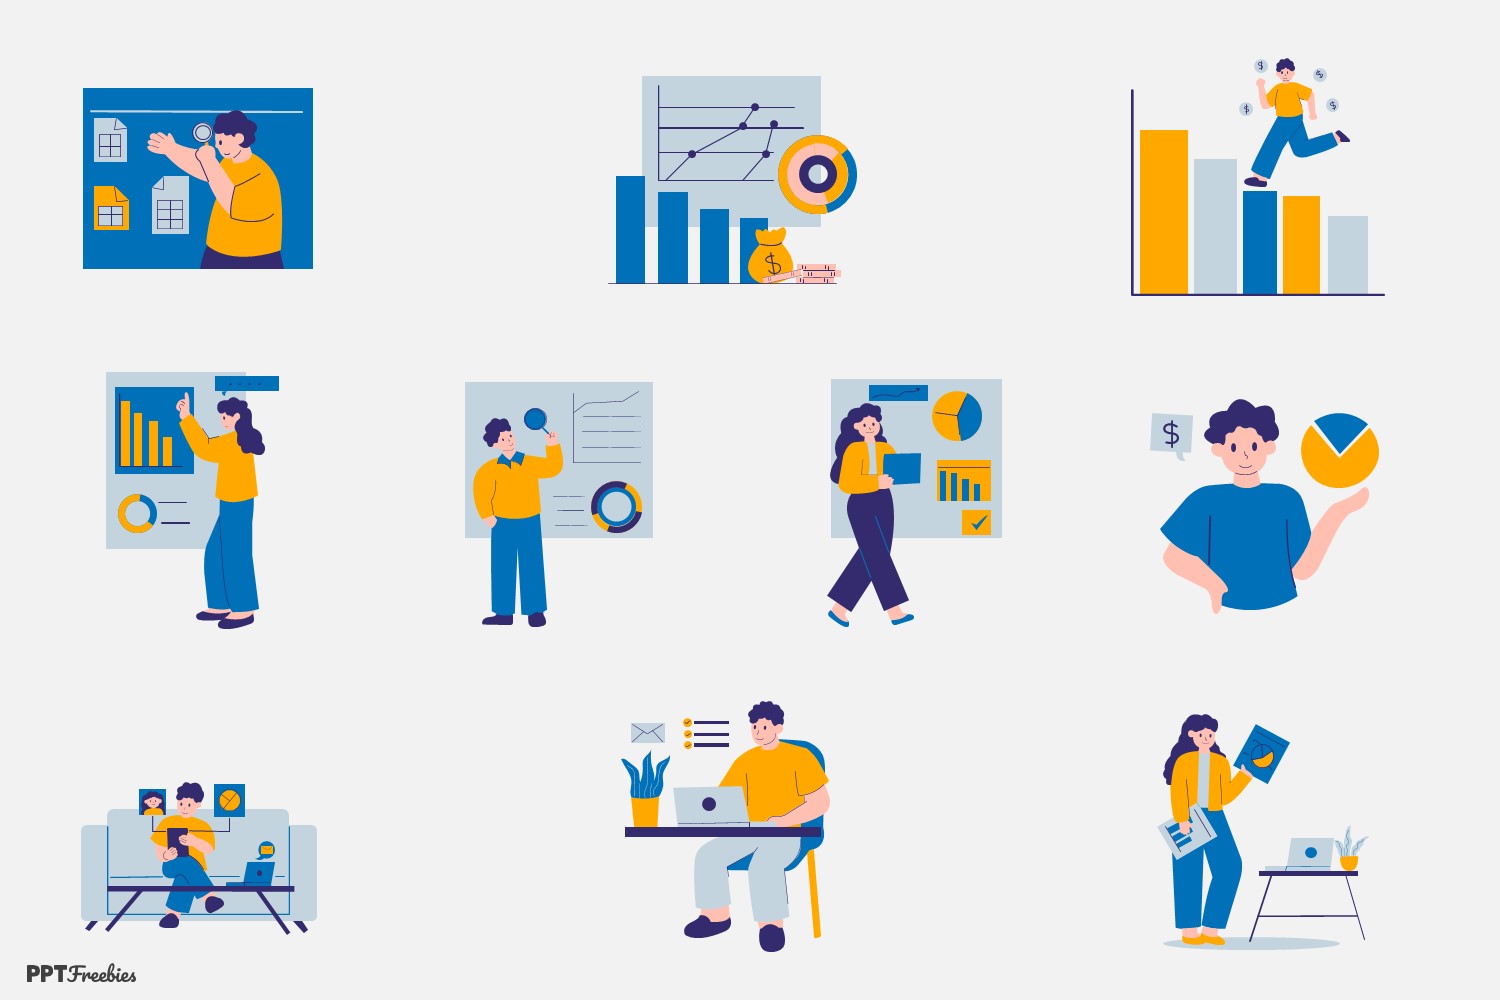
A 10-piece illustration set showing office work paired with charts and dashboards—bar graphs, line plots, and pie visuals. The scenes feature friendly characters presenting insights, working on laptops, and reviewing report panels with bright blue-and-yellow accents. This illustration set focuses on everyday office analysis moments: presenting bar charts, checking line trends on a report panel, and highlighting results with pie and donut visuals. The palette leans on deep blues with warm yellow accents, while light gray “dashboard cards” keep the charts readable.
Key Features :
- Includes 10 coordinated illustrations (as shown in the preview set)
- Repeated data-visual theme: bar, line, and pie/donut charts
- Office context: laptops, report panels, and presentation gestures
- Consistent blue/yellow color system across characters and graphics
- Commercial License (as provided)
- Download formats: SVG, PowerPoint (copy-paste), Google Slides (copy-paste), Canva (editable)
Best Used For :
- Business reporting pages (weekly/monthly results)
- KPI dashboards and performance summaries
- Internal presentations: planning, goals, and progress updates
- Training materials about analytics or reporting workflows
- Team updates and project status sections
Author
File Type
SVG
License
Commercial Use
Total Element
10